#dataviz
Storytelling with data at NASA's Earth Information Center
Slides for my talk at the R Government conference on 10/19/2023. Don't let data speak for itself, it's our job as data scientists and visualizers to interpret the stories hidden in the data and convey them to stakeholders and decisionmakers.
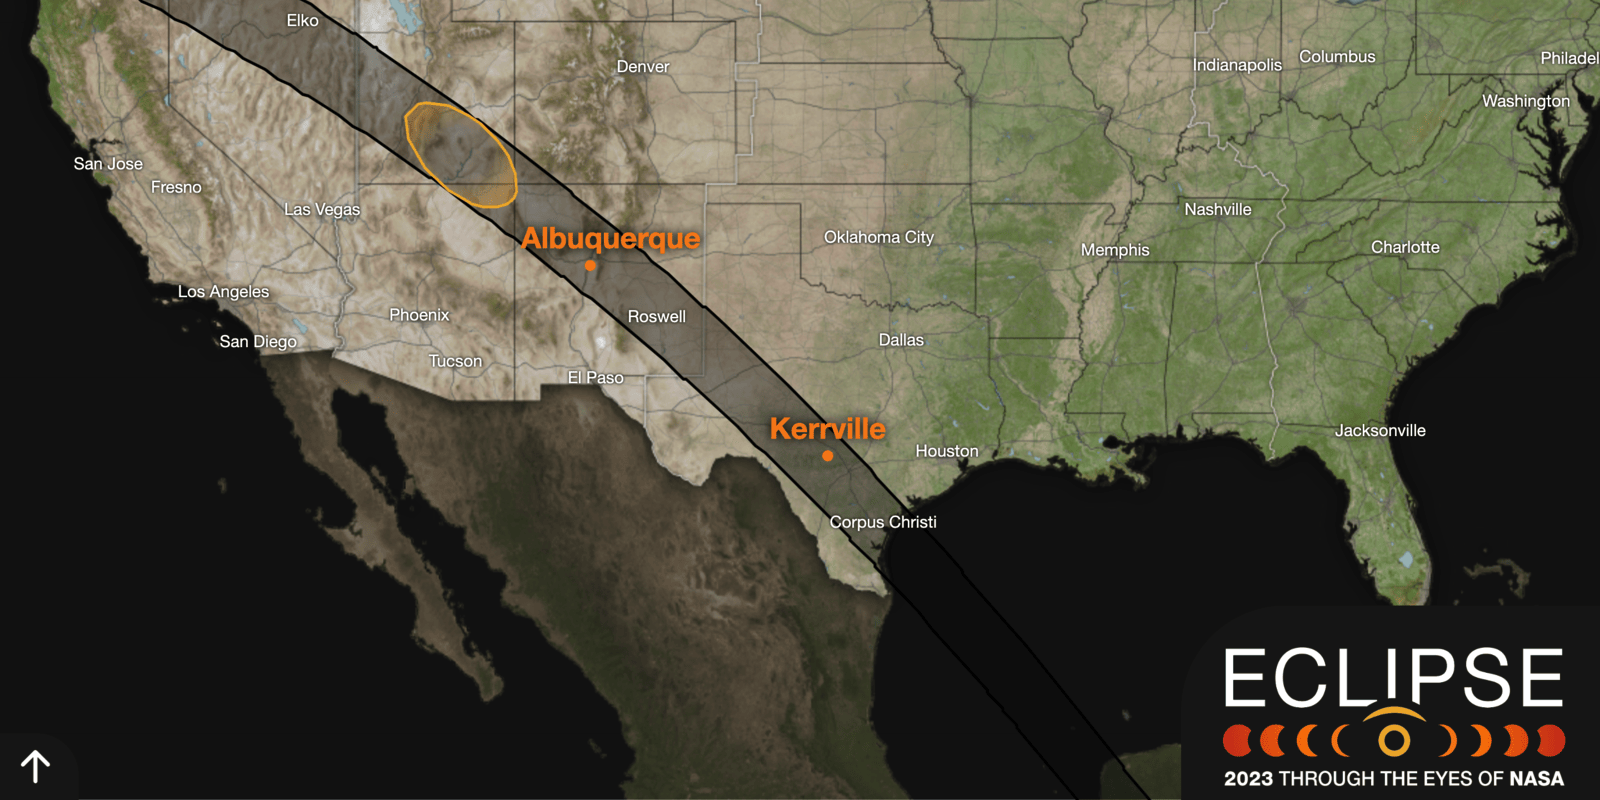
2023 Eclipse Explorer: an interactive guide to the 2023 annular solar eclipse
The 2023 Eclipse Explorer is an interactive web map that allows users to track the annular solar eclipse that occurred on 10/14/2023 over the United States.
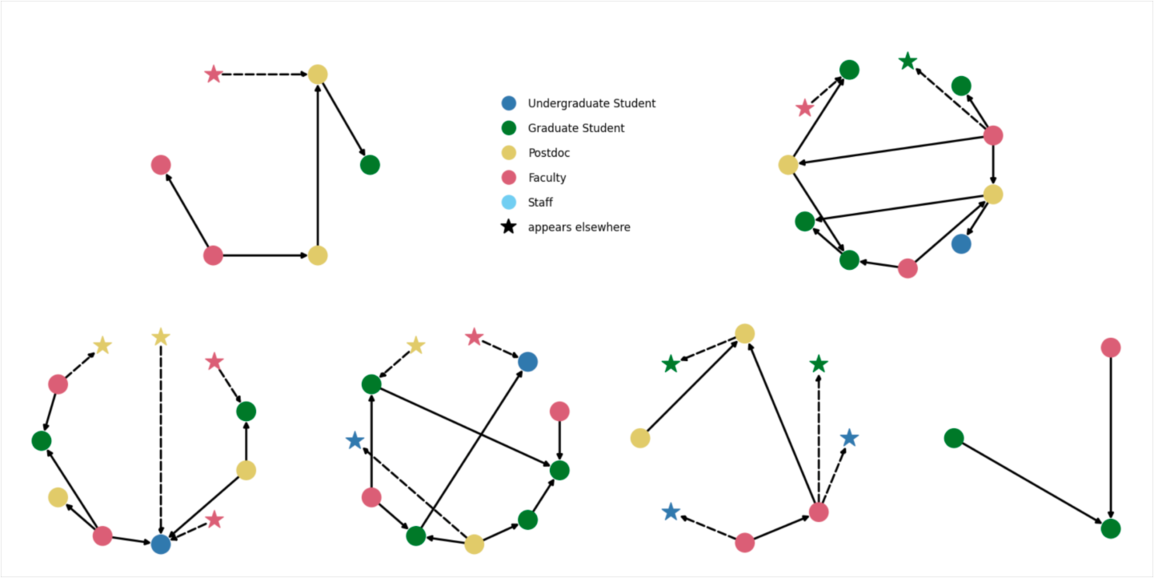
Using graph theory to benefit mentorship: a case study on using data science to impact department climate
As one of the leaders of my department's Mentorship Action Team I designed and implemented a framework using network graph theory for optimizing mentor-mentee assignments into a complex hierarchical social network.
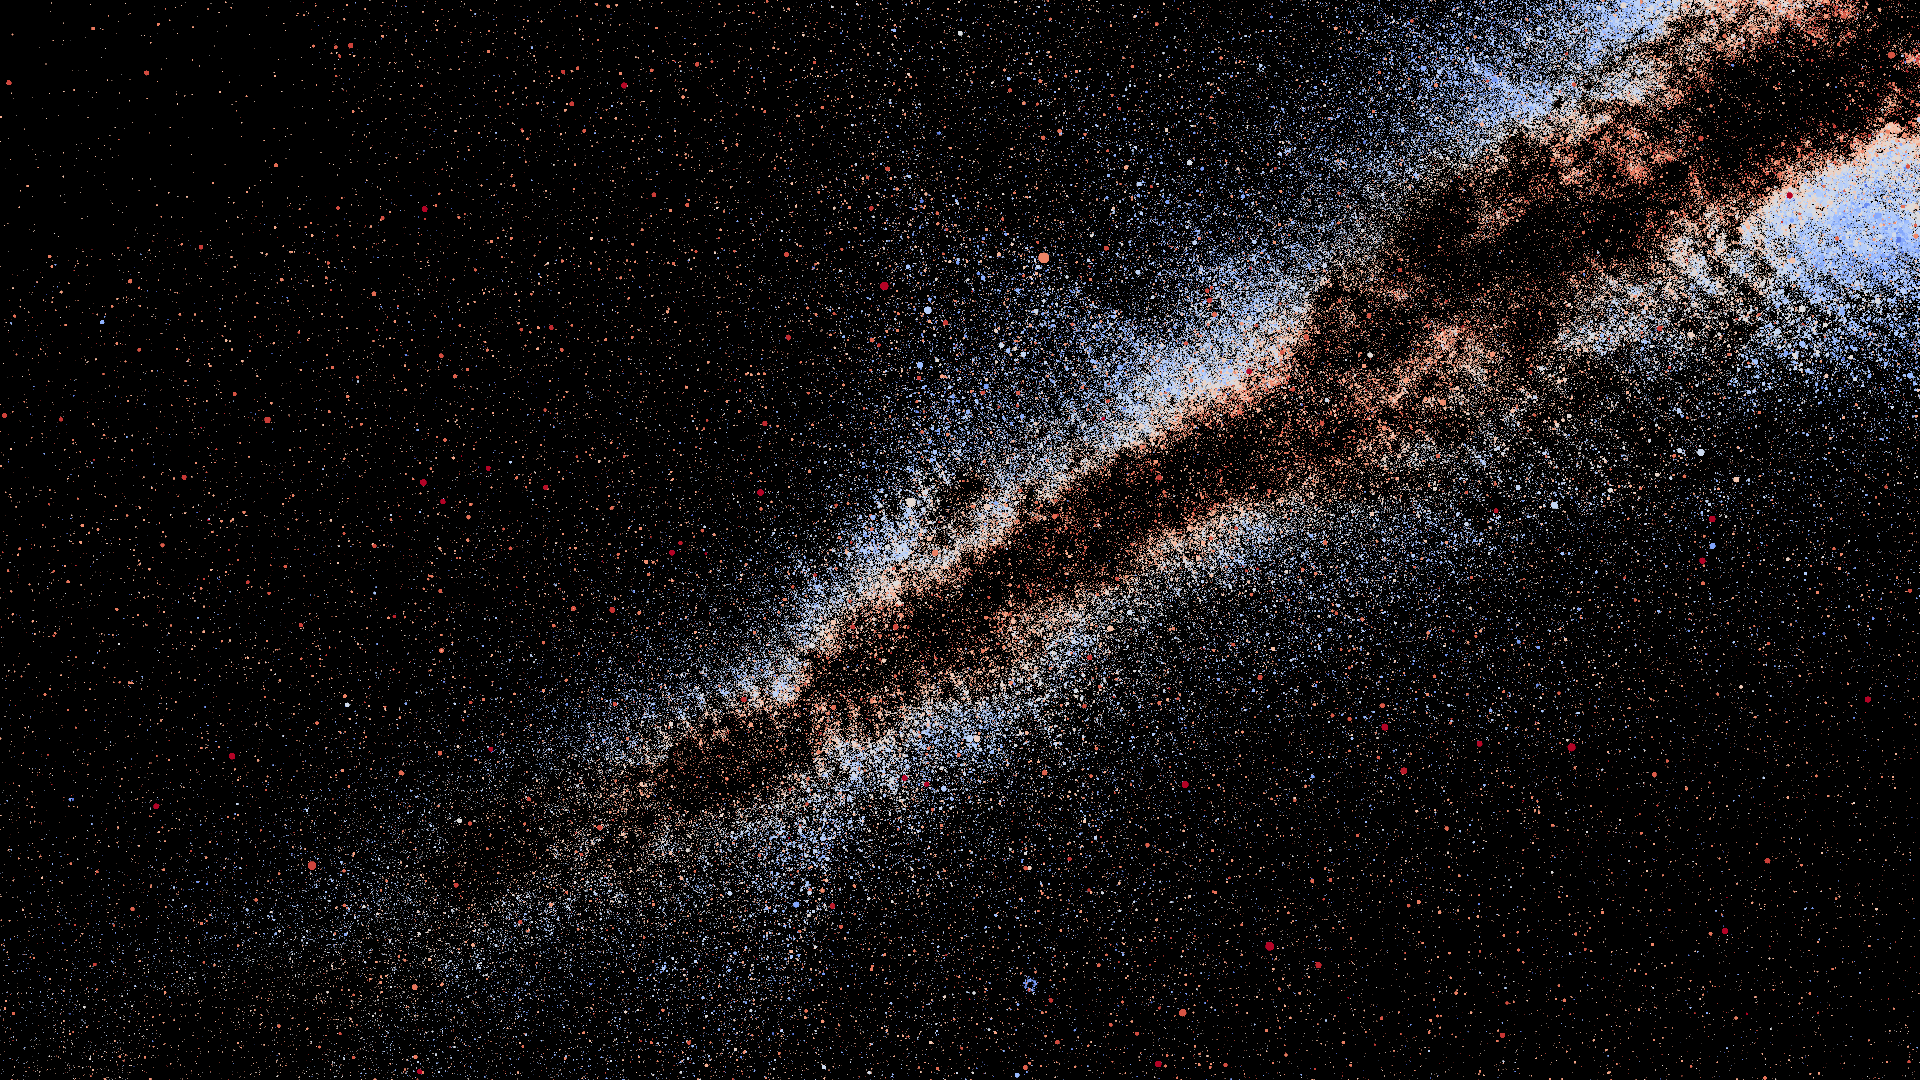
Exploring Gaia DR3 with Firefly
I designed a massively parallel algorithm and progressive rendering scheme in order to interactively visualize all 1.5 billion+ stars observed by the Gaia satellite.

Firefly: an interactive dataviz software for millions of datapoints
Firefly is a cutting-edge 3D browser-based, interactive, data visualization software designed for tens of millions of datapoints.
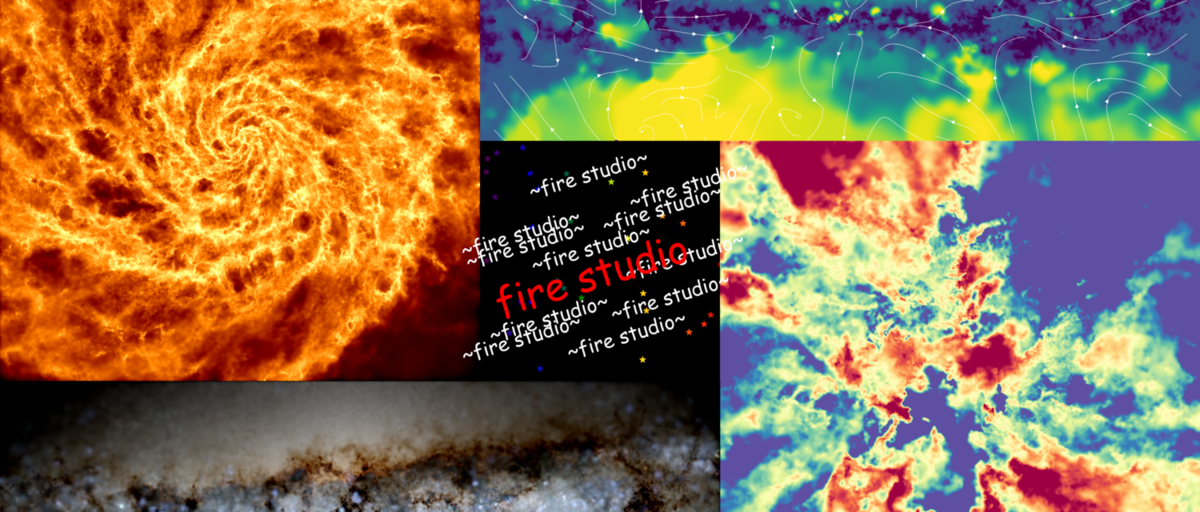
FIRE Studio
FIRE studio is a visualization package I created to streamline the process of producing publication-quality images of galaxy formation simulation data.